Iva Babukova - Can Open Source Cure Cancer | Turing Fest 2021
We are just a few issues away from making single-cell RNA-sequencing (scRNA-seq) a game-changer in cancer research. One of those issues is that scRNA-seq research is still hampered by the data analysis and bioinformatics involved.
At Biomage, we host a community instance of Cellenics® - a cloud-based analytics tool for scRNA-seq data. This software is fast and user-friendly, so biologists don't need to be bioinformatics experts or have prior coding experience to analyze single-cell data.
Find out more about the Biomage-hosted community instance of Cellenics® here: https://www.biomage.net/
In her presentation at Turing Fest 2021, our co-founder and Chief Technology Officer Iva Babukova described how the Cellenics® development team have shortened the time to analyze single-cell RNA sequencing data from several months to just a week. Read below some of the highlights from her talk!
“My background is software engineering. I love solving problems, especially those that make a difference in people’s lives. This is why I created Biomage. ”
Building Cellenics® - a single-cell analysis tool
Single-cell sequencing has a huge potential to revolutionize cancer research, but there are still a couple of things we need to do to get there. And one of them is that we need to resolve the big bottleneck, which is data analysis.
“There are many biologists out there (…), and they have to wait for years to get their data analysis done. We cannot afford this. This is stopping us from progressing. This is stopping research. This is stopping treatments.”
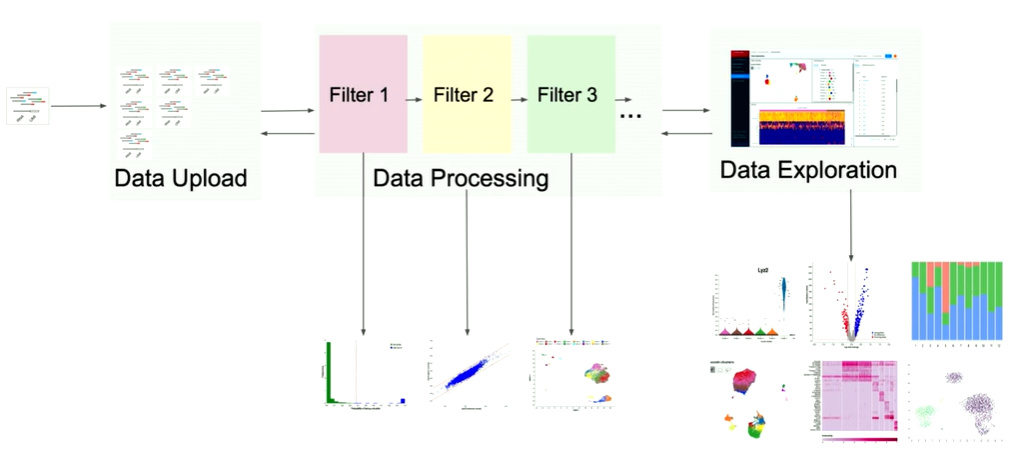
So, here's what we did. Together with Harvard Medical School, we built the first open source cloud-based web platform for single-cell sequencing analysis where a user without any bioinformatics or programming skills can just come in, login, upload their data set, click analyze, and their experiment is there - processed and analyzed.
How the Data Exploration module in Cellenics® works?
I want to focus now on data exploration because this one is very exciting. Because, here, we not only have to work with large data files, but we also have to make sure that it's all highly interactive. So, let me tell you a bit more about data exploration. What you can see here is a different visualization of this R object.
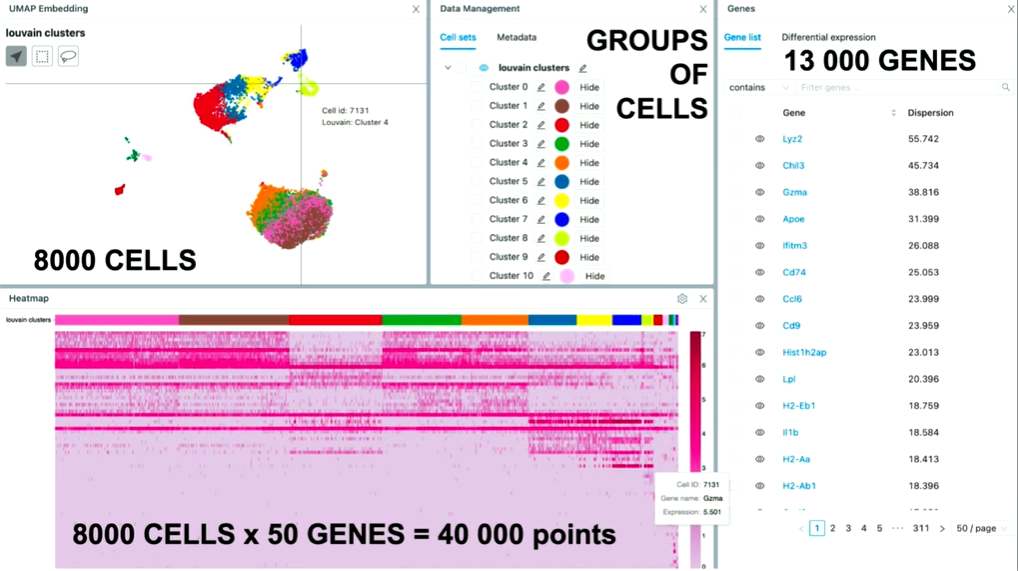
On the top left, you can see the embedding. And the embedding is this nice picture of lots of cells. And under the hood, we've run some specialized machine learning algorithms that determine how close each cell should be. So, what you're looking for here is a dimensional reduction from 20,000 genes up to two-dimensional space where we take cells, and compute how similar they are based on the level of expression of the genes that they have (…). And then if they're close on that, we put them close together. (…). And this embedding, on average, has 8000 cells. So that's 8000 points on that plot.
Similarly, we also have all the genes on the right side of the gene list (about 13,000 of them). The user needs to be able to go through pages, scroll, search for genes, and select them. If they select the gene, then that changes the embedding.
And we also have this heat map, which is a matrix of all the cells in the experiment, and for each cell, the expression for a particular gene. So on average, we've seen that users use about 50 genes. So, only for the heat map, that's about 40,000 points.
And now the way it works is that the user goes over the embedding, they check out some cells, they go over the heat map that changes. Then it's all highly interactive. And we need to make sure that all of this works immediately. There is no slowdown; there is no waiting time.
So all of this that we have here is powered under the hood of this black box that we call the worker. So what a worker is - it’s essentially some bioinformatics code written in R, which are all the methods, so the single-cell sequencing methods or tasks, and they're written by our bioinformaticians in the team. And this bioinformatics code works on this R object, which we also call the count matrix file. And this is essentially a big matrix containing cells as columns, and genes as rows. And it contains information for each of them. This matrix changes every time we run data processing, just because when we go back, and when we change the filter settings, we filter more or we filter less cells. And then this matrix changes and we have to go back and re-download it.
To make sure that it works, and can communicate with external services, we've wrapped it around the Python wrapper. So that's just some Python code that handles all the communication with S3, with our UI, and everything like that. We put all of that in a Kubernetes pod.
And now what's happening is we have our S3 bucket, we have our UI, and every time the user wants something on the UI, say they want a heat map, the UI asks for the heat map. And then the Python wrapper receives the request. And it tells the bioinformatics code to compute that heat map. Bioinformatics code uses that count matrix, that R object, does some statistical modelling, some analysis. And after a while, it comes up with this answer. And the answer is about 40,000 data points. It puts out that answer in S3 and tells the UI that the answer is there. And then the UI downloads it and displays it to the user. And the heat map appears.
So that’s happening with the embedding, that's happening with the gene list. And now we're running in AWS, so we put all that in an easy instance. And because the count matrix file is different for every experiment, we also have one worker handling one user. So if you have two users, you have two workers, if you have five users, you have five workers. So, one-to-one mapping between worker and user.

Single-cell analysis in cancer research
One of the users that we got was Cindy from Harvard Medical School, and 20 minutes into her analysis, she managed to find out what her cancer treatment worked.
So what Cindy did was she had two samples. One sample was all patients with the treatment. And the other sample was all the patients before the treatment. So she did the processing in the platform. And then afterward, she looked at the embedding, she looked at the heat map, and she managed to identify which were the cancer cells. So which cluster has those cancer cells by using the heat map and evaluating which is the marker gene for that.
And then afterward, she went back; she looked at her other sample, which was with all the treated patients. And what she could essentially see is that her cancer treatment worked. So, this entire cluster with the cancer cells just wasn't there. Her treatment works. And as an engineer, the first time we saw this, I was like, oh, maybe the platform is broken. But then we went back and we looked at it. And indeed it was there, it was working. (…) And that was exciting.
Next challenges
And now this brings us to think about what are the next challenges? What can we do next?
We know that the field is moving fast. New methods are developing as we speak. And to succeed in our mission to improve human health, we have to allow researchers to use freely and easily those methods. So how do we make sure that happens?
Well, we can just rather leverage the fact that we're open source. We can make sure that we build a community where bioinformaticians can contribute methods, and biologists can use them quickly. And then together, I'm pretty sure we can help treat cancer and it's only a matter of time.
“We can make sure that we build a community where bioinformaticians can contribute methods, and biologists can use them quickly. ”
Full talk- Can Open Source Cure Cancer
You can listen to the full talk on the inner workings of Cellenics® below or on the Turing Fest’s website here: https://www.turingfest.com/videos/iva-babukova-can-open-source-cure-cancer.
All rights to the audio-visual recording of the talk belong to © Turning Fest.
Disclaimers:
The talk is transcribed clean verbatim with corrections for readability.
Cellenics® is an open source software developed by © 2020-2023 President and Fellows of Harvard College. Biomage is an open source software company that provided services to Harvard Medical School for the design and development of Cellenics®.