
RNA van Winkle writes...
I graduated with a medical degree in 1981 but having decided doctoring wasn't for me; I promptly took a 40-year sabbatical in IT which ended in early retirement a few years ago. Meantime, my younger daughter was studying Biomedical Sciences and was bandying about as run-of-the-mill things that my lecturers had hinted at in hushed tones as "possibilities for the future if not actually science fiction". What had I missed? I guessed this was maybe how Rip van Winkle felt after his time out of things. I decided it was time to try to get back up to speed in the Life Sciences... but how?
I'd read a lot about DNA sequencing and even shadowed a Molecular Biology course at my old place of work but still felt way off the pace when looking at current research papers. How could I get up to date? I needed a focus and after a false start with "genetic genealogy", I plumped for scRNA-seq as the target topic to try to understand. It hadn't even been mentioned in my recent course but it's all over the journals. At first sight, it seems impossible, how could anyone separate out individual cells and then extract and sequence RNA from each one in parallel? Maybe I was in science fiction territory after all?
Determined to see if it was all just a spoof, perhaps akin to the “moon landings” actually being filmed in the Arizona desert (or so a guy in a pub once told me), I started looking for an accessible entry point and that's how I came across Biomage, the company who host a community instance of Cellenics®. I read the web page and, seeing the price (or lack thereof) was right, I signed up for a free account. I ran through the tutorial and everything seemed to work as described. Ok, so far so good, but what to do next? At which point I received an email from Vicky welcoming me and asking if she could help me at all. We had a chat and she very helpfully suggested a way to get to grips with the area might be to try to replicate the results in a published paper. Great idea, I thought, but what paper? I did a search looking for a recent paper that used scRNA-seq, which was transparent in describing the bioinformatics used, and, most importantly, gave a clear pointer to where the experimental data could be downloaded. Bingo! I found Phoebe Kirkwood’s paper (Kirkwood et al, 2021) which had the added bonuses of being from a local research group in an area I knew a tiny little bit about. The next step was to get the data into the Biomage-hosted instance of Cellenics®.
It was a fairly straight forward to go to the NCBI’s Gene Expression Omnibus to download the various files (from https://www.ncbi.nlm.nih.gov/geo/query/acc.cgi?acc=GSE160772) and rename them to as required following the explanation on the Cellenic’s “Data Management” dialogues for creating a new project.
Eek! The time had come. I was about to do my first scRNA-seq analysis. Not only that but I was going to do it with no clear idea what I was doing. So off I went, fired up my laptop, navigated to the Biomage login page for Cellenics®, logged in and hit the "Data Processing" button. Cellenics® started working through its various stages and I watched with bated breath as the little progress bar steadily changed from grey to orange to green as it completed each step. Being an impatient sort, as soon as a step went green, I opened it up and looked at the results. To be honest, with no idea what "Classifier filter" and "Doublet filter" meant, the first few steps weren't that interesting but once we got to the final stage, "Configure embedding", I was amazed to see a beautiful plot that looked very similar to the cluster plot in the paper.

Plot from Kirkwood et al, 2021

Plot from Cellenics®
Ok, it wasn't exactly the same as initially it had 7 clusters rather than 6 as in the paper and the positioning of the clusters was different but it was pretty close. I then played with parameters to see what happened hoping, I suppose, I'd magically find the right value and fix the "extra cluster" problem. Not surprisingly this approach didn't work. It turned out that the defaults were better than my increasingly frantic random selections - who’d’ve thought, eh?
Before I destroyed anything else, I thought I ought to compare some of the other plots from the paper and from Cellenics®. It all seemed to go rather well. As an example, here are the violin plots of various canonical cell type markers:

Plots from Kirkwood et al, 2021 Equivalent plots from Cellenics®
It was an odd feeling though. While apparently I'd completed an scRNA-seq analysis, I'd no idea really what I'd done or what it meant but I definitely felt inspired. It was time to hit the Internet again and try to learn some of the background!
I soon found a number of tutorials online and chose the Harvard Chan Bioinformatics Core one (https://hbctraining.github.io/scRNA-seq_online/). Comparing the steps in Cellenics® and the steps in the processing pathway described in the tutorial, I began to piece things together. Soon I was ready to play with the parameters again but now knowing some of the rules of the game.
By tweaking the resolution parameter for the Louvain community detection algorithm I ended up with an almost identical cluster plot to that in the paper albeit rotated by 90 degrees but that's hardly material so I was delighted. My next challenge was to work out how they allocated cell type names to clusters. I looked at the heat maps and saw "marker genes" so it looked like it was done by looking for "well known genes" that marked out cells as being of known types. It seemed straightforward enough so I started searching for the ISO list of standard marker genes. Ah but there isn't one. This meant it was quite hard for someone with no relevant domain knowledge but I came to see how reading the differential expression data via the heat maps, violin and dot plots, etc. you could do this although I must admit to a bit of cheating here and there by using the paper to fill the huge gaps in my knowledge.
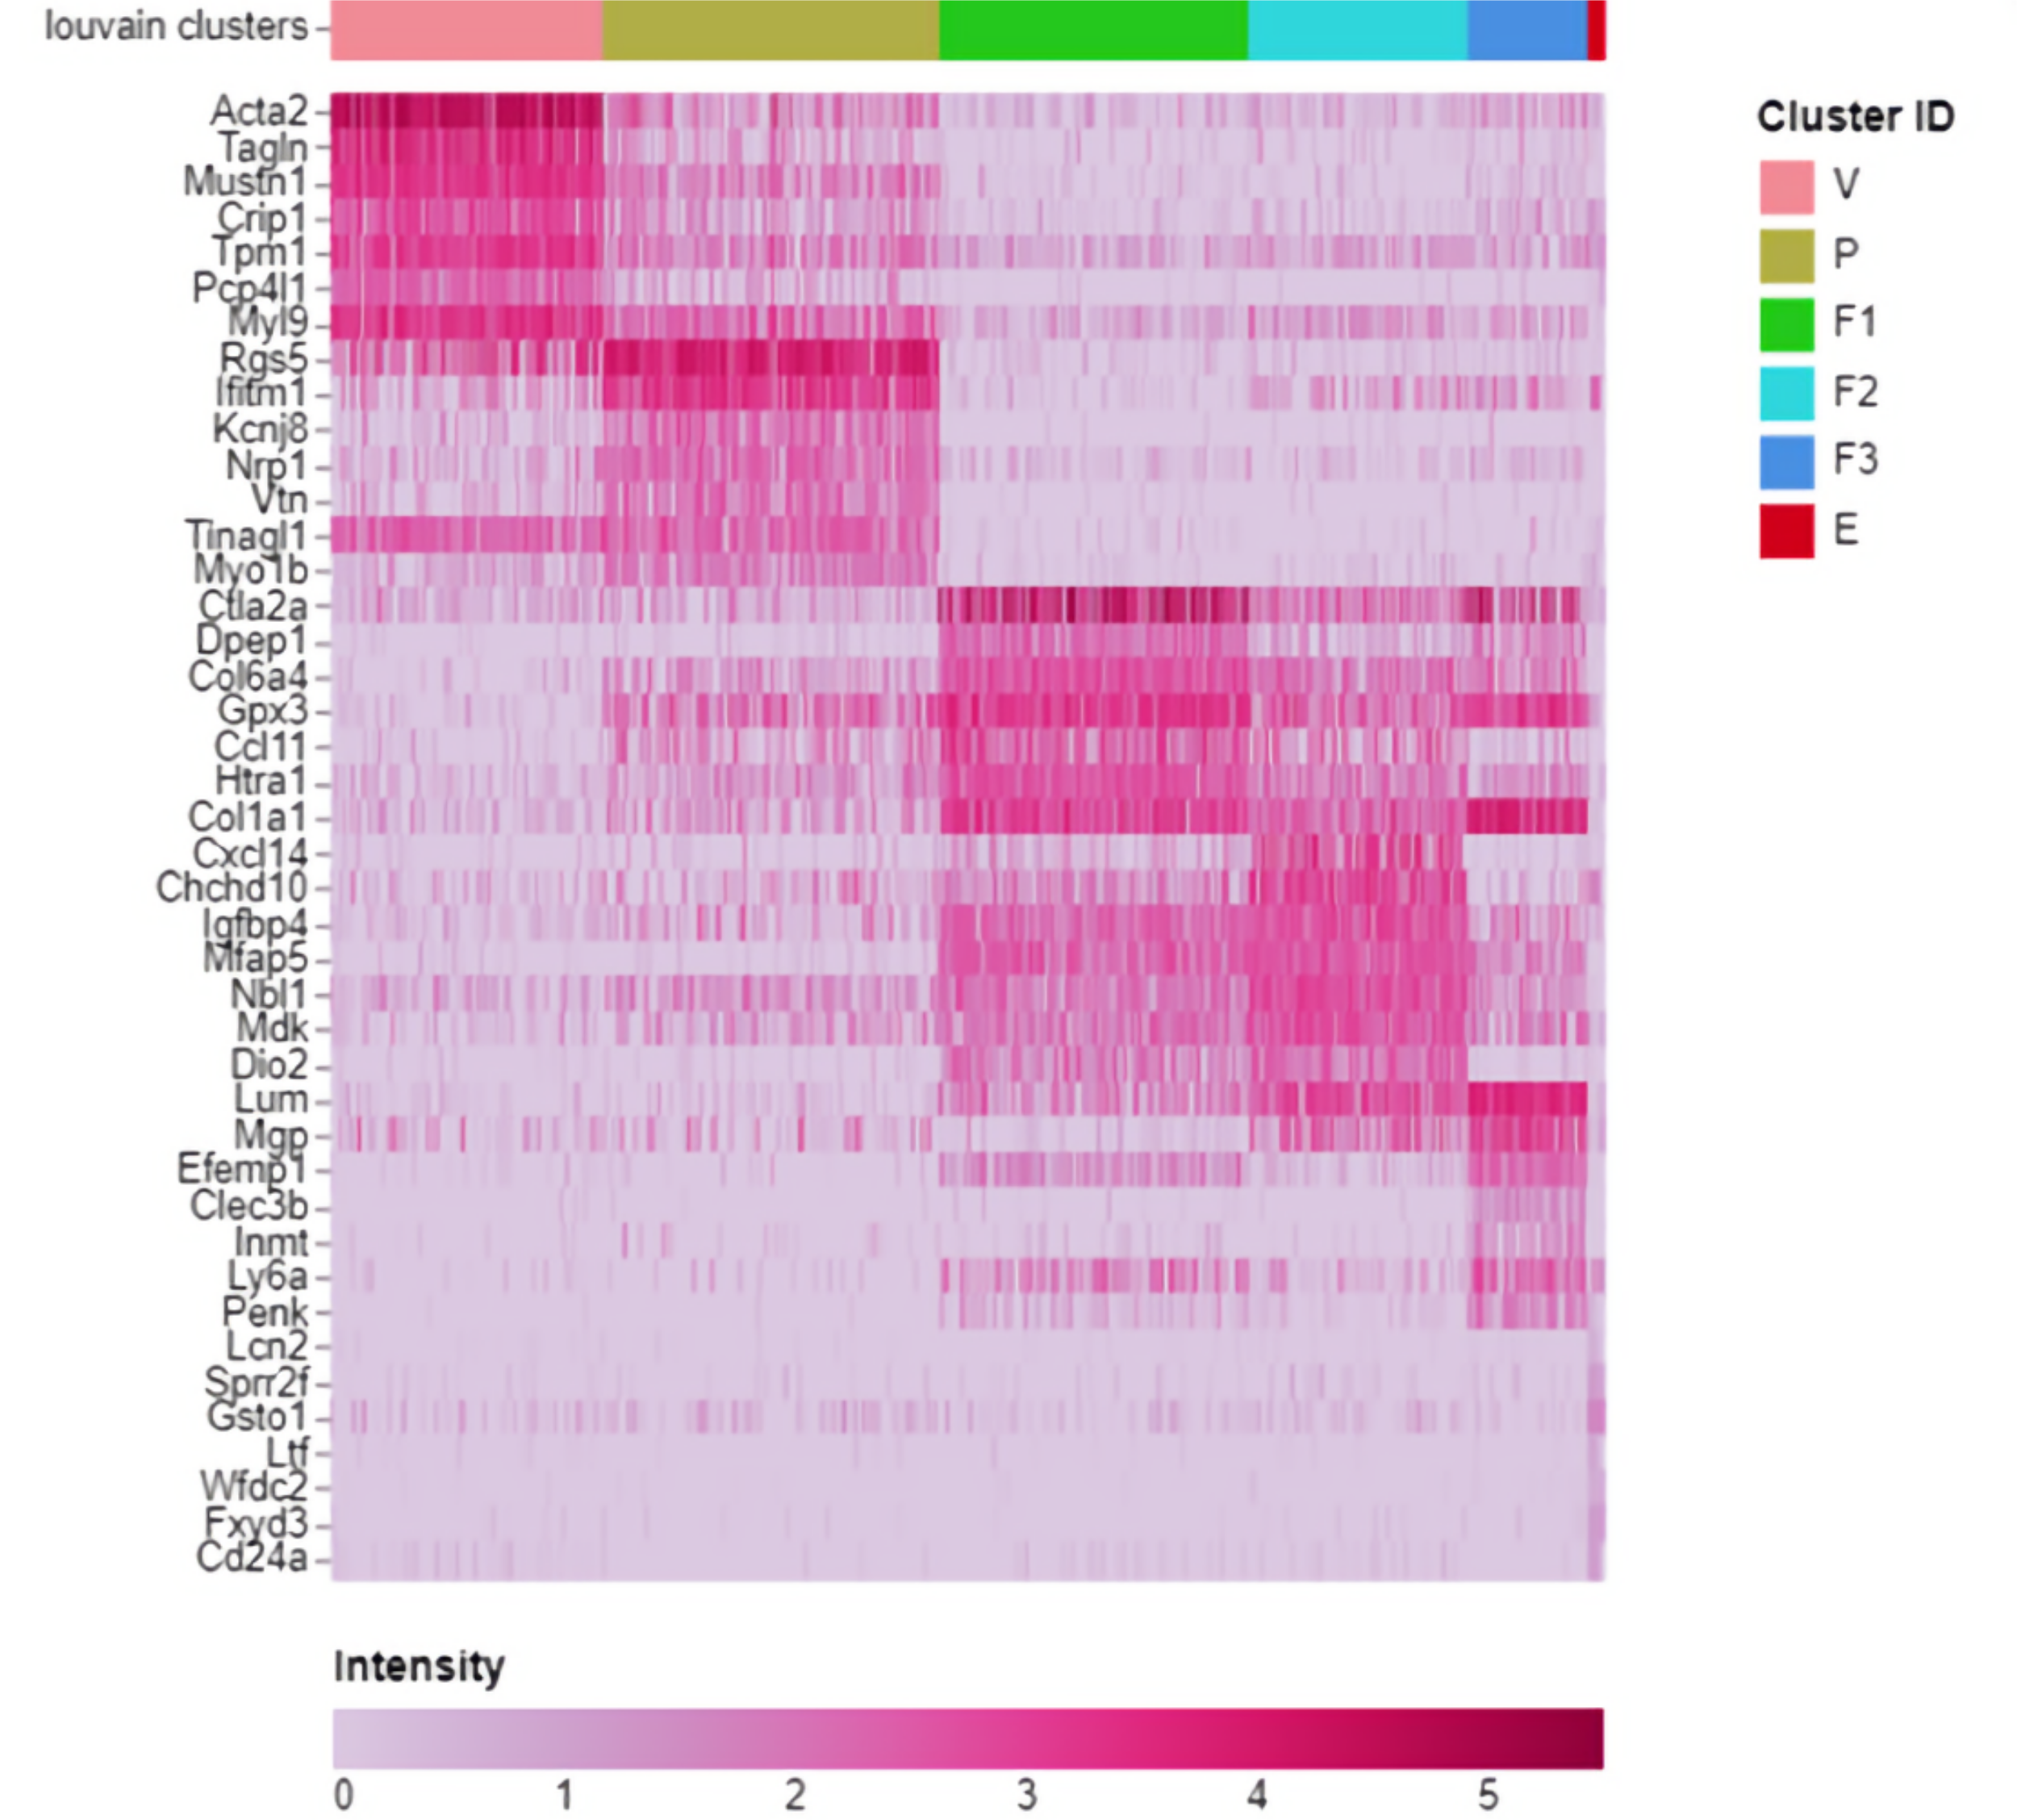
Marker Heatmap from Cellenics®. Legend: V – Vascular, P – Pericyte, F1-F3 – Fibroblasts groups, E – Epithelial.
I now had my named clusters and had pretty much had achieved my goal!
Wow, so there you go – ‘Zero to Hero’ in ten weeks… well, ok, maybe more ‘Duffer to Bluffer’!
Reference
Kirkwood, P. M., Gibson, D. A., Smith, J. R., Wilson-Kanamori, J. R., Kelepouri, O., Esnal-Zufiaurre, A., Dobie, R., Henderson, N. C. & Saunders, P. T. K. 2021. “Single-cell RNA sequencing redefines the mesenchymal cell landscape of mouse endometrium”. Faseb j 35: e21285. doi: 10.1096/fj.202002123R.

Steven Salvini
LinkedIn account https://www.linkedin.com/in/stevesalvini/
Twitter account https://twitter.com/steven_salvini